
A load board lists available freight for carriers to accept. It is a useful instrument and a poor operating model. A fleet that builds each day from whatever is posted that morning has outsourced its planning horizon to a screen. The cost then shows up as a thin margin nobody can locate.
The board sets the price, and the carrier accepts it
Spot freight is priced by whoever posts it, against however many carriers are looking.
That means a carrier booking exclusively from a board is a price taker in every transaction. In a loose market that produces rates below what it costs to run the truck. In a tight market, it produces windfalls that conceal the underlying position until the market turns again.
The variability is the actual problem, not the average. A business that cannot forecast next month cannot plan equipment, hiring or maintenance, and every one of those decisions gets made late and expensively.
The sector is large. The Bureau of Labor Statistics counted about 2.2 million heavy and tractor-trailer driver jobs in 2024, with 4 percent growth projected through 2034. The carriers who do well across a cycle are rarely the ones who chase the best posted rate.
No cost per mile means no decision
Accepting a rate without knowing the cost is not negotiating. It is guessing with a truck attached.
Cost per mile has to include fuel, wages, insurance, equipment payments or depreciation, maintenance, and reserve for it, and a share of the office. When calculated properly, it is usually higher than the figure a carrier carries in their head, and the gap explains many thin years.
It has to be calculated per truck rather than for the fleet. A paid off tractor and one under finance produce very different floors, and averaging them hides which equipment is carrying the operation.
Once the floor is in place, the board becomes usable. Rates below it get declined without discussion, and the dispatcher stops relying on the feeling that a load is probably fine.
A worked example, run through a real tool
The company described below is fictional. It was invented for this article and run through two free assessment tools to show what the output looks like. No real client, company, or person is described. The figures are tool output on invented inputs, not market data or benchmarks.
The simulated profile is a regional trucking and freight company. Revenue between three and eight million, sixteen to thirty staff, ten to twenty years in business, owner working sixty to seventy hours a week.
The weaknesses entered describe absent measurement: every load plan depends on the owner, driver settlements are calculated by hand, and there is no cost per mile by lane or by truck.
What the assessment returned

The briefing pairs published benchmark figures with what the owner actually typed. It names the source beneath each block rather than presenting the numbers as its own research.
Execution to Ambition Ratio: 0.65. Founder Dependency Index: 5.9 out of 10. Organizational Readiness: 42 out of 100.
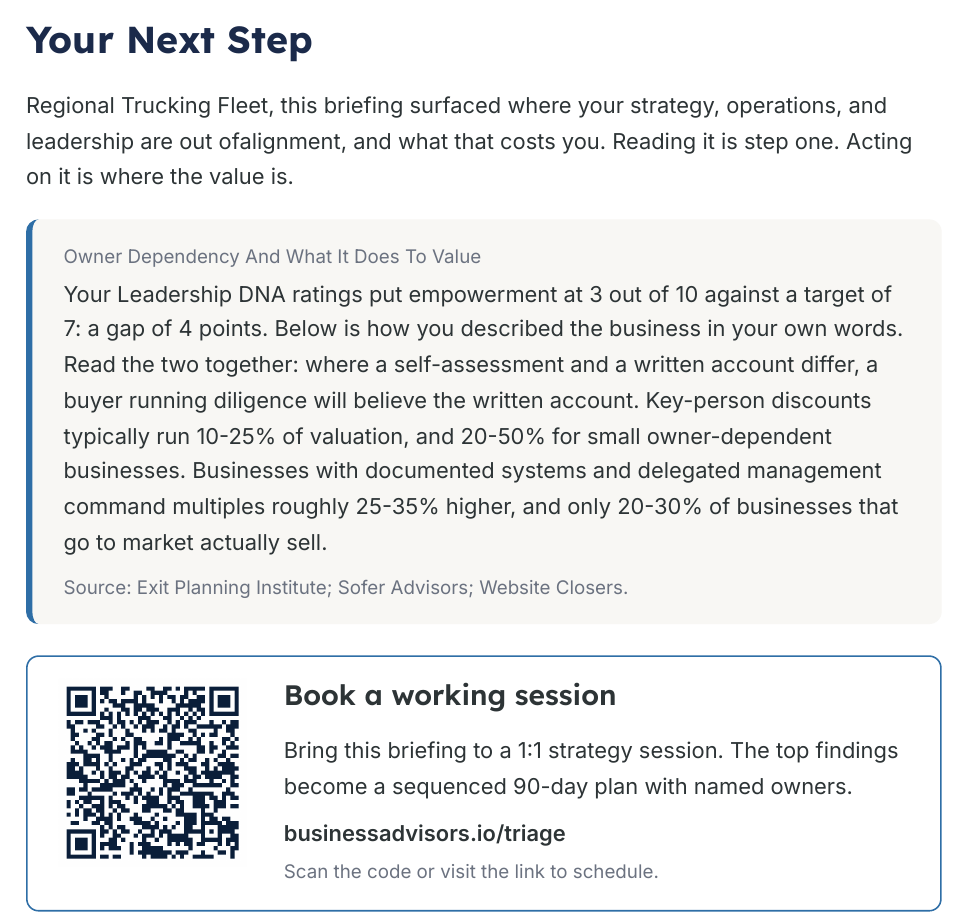
The closing page states what the briefing considers the immediate action rather than leaving the reader to assemble one from the preceding pages.
For a fleet living on the board, the immediate action is almost never a commercial one. It is the arithmetic that makes commercial decisions possible.
The dispatcher is the constraint
Reactive booking looks like a market position and behaves like a staffing problem.
A dispatcher building each day from scratch spends the morning on the board and the afternoon solving what the morning created. No capacity remains for the work that would reduce the scramble the following day. That is a full-time job producing a fleet that runs but does not improve.
The relief is not a faster dispatcher. It is a shorter list of decisions, which comes from a defined lane strategy and a floor rate. Both of those remove choices rather than adding tools.
It is also worth noting what the arrangement does to the person. Dispatch under permanent reactive pressure has predictable turnover, and each departure takes with it the informal knowledge that made the arrangement survivable.
Carriers reviewing structure should read trucking business consultant.
Booking whatever is posted at seven in the morning? Sales Roadmaps builds the floor and the lane plan. Start with the operations roadmap.
Mix is the objective, not replacement
The goal is not to abandon the board. It is to stop depending on it.
A fleet with a share of committed freight has a base that covers fixed costs, and it can then use the board opportunistically for the remaining capacity. That is a completely different posture from booking every truck every day.
The board also becomes more valuable in that configuration because the carrier can decline. Optionality is what turns a spot market from a threat into an advantage, and optionality requires having somewhere else for the truck to be.
A workable first target is a modest share of revenue under some form of commitment. That is small enough to be achievable in a quarter and large enough to change how every subsequent rate conversation goes.
The rate per mile is the wrong comparison unit
Carriers compare loads on a per-mile basis, and the comparison is frequently misleading.
Revenue per truck per day is closer to the truth because it accounts for the time a load takes and the distance it covers. A long haul at a modest rate can outperform a short haul at an excellent rate once loading, waiting, and repositioning are counted.
Two loads with identical rates per mile can differ enormously on this measure. One loads promptly and runs. The other sits at a dock for four hours and delivers into an area with no outbound freight.
Switching the comparison unit is free and changes which loads look attractive. It also gives the dispatcher a defensible reason to decline something that scores well on the obvious number.
Committed freight has to be earned, not requested
Carriers pursuing contract volume frequently approach shippers with nothing to show.
A shipper awarding committed freight is buying reliability rather than price. What convinces them is evidence. On-time performance on the lane, claims history, insurance, and safety standing, and a clear statement of how many trucks are available on which days.
Most small carriers have that record and have never assembled it. A single page showing lane performance over the preceding six months is a stronger opening than a rate quote. It takes an afternoon, from the data the fleet already holds.
The approach also has to be specific. A request for freight generally invites nothing. A request to cover a named lane the carrier already runs well, at a stated capacity, is a proposal the shipper can actually evaluate.
Read the board as intelligence
Most carriers use the board only for transactions. It is also the best free market data available to them.
Which lanes consistently show many loads and few trucks? Where rates hold when the market softens. Which origins reliably produce a return load and which strand equipment? All of that is visible over a few weeks of observation, and almost nobody records it.
A simple log of posted volume and rate on the lanes a fleet cares about builds a picture that informs where to pursue direct freight. The lanes worth selling into are the ones the board says are structurally tight.
That converts the board from the thing that sets the price into the thing that tells the carrier where to go and build a position.
Equipment and utilization sit in fleet management consultant.
The sixty-second version
The same situation was typed, in plain language, into a second free tool that returns a written diagnosis rather than scores.

The diagnosis reads load board dependence as reactive operations rather than as a market condition, which is the framing that makes it fixable.
Market conditions are not addressable by a single carrier. Operating posture is. The difference between the two is whether a fleet has a floor rate and somewhere to put a truck other than the next posting.
Where this is not the constraint
If the fleet is new or very small, the board is the correct channel, and building committed freight prematurely would leave trucks idle.
If the cost per mile is unknown, that comes first. Every recommendation here depends on being able to say which loads are worth running.
Both tools used here are free. The written one is at businessconsultant.services, and the scored briefing is at vwcg.app.
The short version
Booking exclusively from a load board makes a carrier a price taker in every transaction and removes any planning horizon beyond the current load. The fix is a floor and a mix, not a better screen.
Calculate cost per mile per truck and decline rates below the floor without discussion. Target a modest share of committed freight to cover fixed costs. Log board volume and rates as market intelligence rather than only as transactions.
Every day starting from zero? Sales Roadmaps gets the fleet off the treadmill. Book a working session.
Frequently Asked Questions
Why is load board dependence risky?
Because spot freight is priced by whoever posts it against however many carriers are looking, making the carrier a price taker in every transaction. The variability, rather than the average, is the problem because it removes any ability to forecast.
What belongs in the cost per mile?
Fuel, wages, insurance, equipment payments or depreciation, maintenance, and the reserve for it, and a share of office overhead. When calculated properly, it is usually higher than the figure the owner has in mind.
Why calculate cost per mile per truck?
Because a paid off tractor and one under finance produce very different floors. Averaging them across the fleet hides which equipment is carrying the operation and which is being subsidized.
Is the goal to stop using load boards?
No. The goal is to stop depending on them. A base of committed freight covering fixed costs allows a carrier to use the board opportunistically and, critically, to decline. Optionality is what makes a spot market useful.
How does reactive booking affect dispatch?
A dispatcher rebuilding each day from scratch spends mornings on the board and afternoons fixing what the morning created. That leaves no capacity for work that would reduce tomorrow’s scramble. Turnover follows, taking informal knowledge with it.
Can a load board be used as market data?
Yes, and almost nobody does. Logging posted volume and rate on lanes of interest reveals which are structurally tight, where rates hold when the market softens, and which origins strand equipment. That is where to pursue direct freight.