Route optimization is the practice of sequencing loads and stops to reduce cost per unit of revenue rather than to reduce distance. Fleets usually buy software for it. The software then asks for a per-mile cost that the fleet does not have, and the project quietly becomes a mapping exercise.
Shortest is not cheapest
The instinctive definition of a good route is the shortest one, and it is wrong often enough to matter.
A shorter route through congestion burns more fuel and more driver hours than a longer route on an open highway. A route that ends far from the next available load produces empty miles that never appear on the first job. A sequence that saves twenty minutes and pushes a driver past an hour’s limit costs a full day.
Optimization means minimizing total cost across the planning horizon, which is usually a week rather than a load. That is a different calculation from the one a mapping tool performs, and it needs inputs that a mapping tool does not have.
The sector is large. The Bureau of Labor Statistics counted about 2.2 million heavy and tractor-trailer driver jobs in 2024, with 4 percent growth projected through 2034. Small differences in cost per mile compound quickly across a fleet.
Deadhead is a planning outcome, not an accident
Empty miles are the clearest measure of planning quality, and most small fleets do not track them separately.
Deadhead arises when a load ends somewhere the next load does not begin. That is decided when the first load is accepted, not when the truck arrives empty. A fleet that books loads one at a time is choosing its deadhead without noticing.
Measuring it changes the conversation. Empty miles as a share of total miles, tracked weekly by truck, turn an invisible cost into a number people can argue about. Fleets that start measuring usually find the figure higher than they assumed, with the concentration in particular lanes.
A worked example, run through a real tool
The company described below is fictional. It was invented for this article and run through two free assessment tools to show what the output looks like. No real client, company or person is described. The figures are tool output on invented inputs, not market data or benchmarks.
The simulated profile is a regional trucking and freight company. Revenue between three and eight million, sixteen to thirty staff, ten to twenty years in business, owner working sixty to seventy hours a week.
The strengths entered describe genuine advantages: owner-operator drivers with more than five years of service, and direct shipper relationships that reduce broker dependence.
What the assessment returned
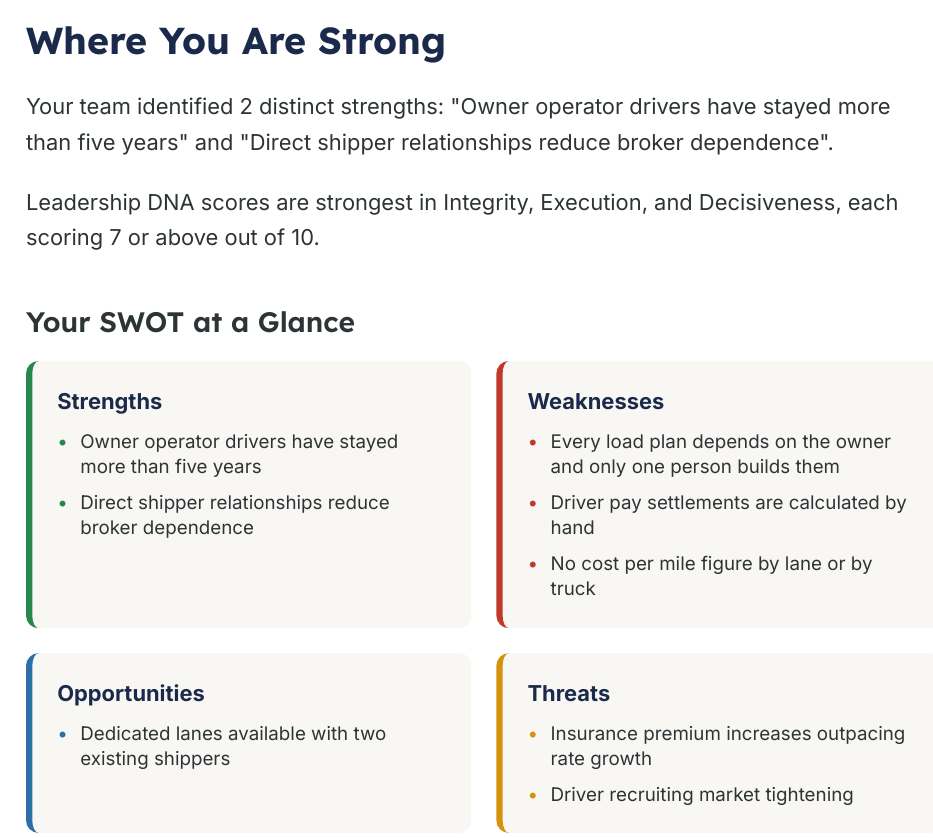
The briefing records the strengths as entered and treats them as assets rather than as evidence that the operation is complete.
Direct shipper relationships are the asset that makes routing improvable. A fleet dependent on spot freight takes what appears. A fleet with direct relationships can shape the mix, which is the precondition for planning anything.
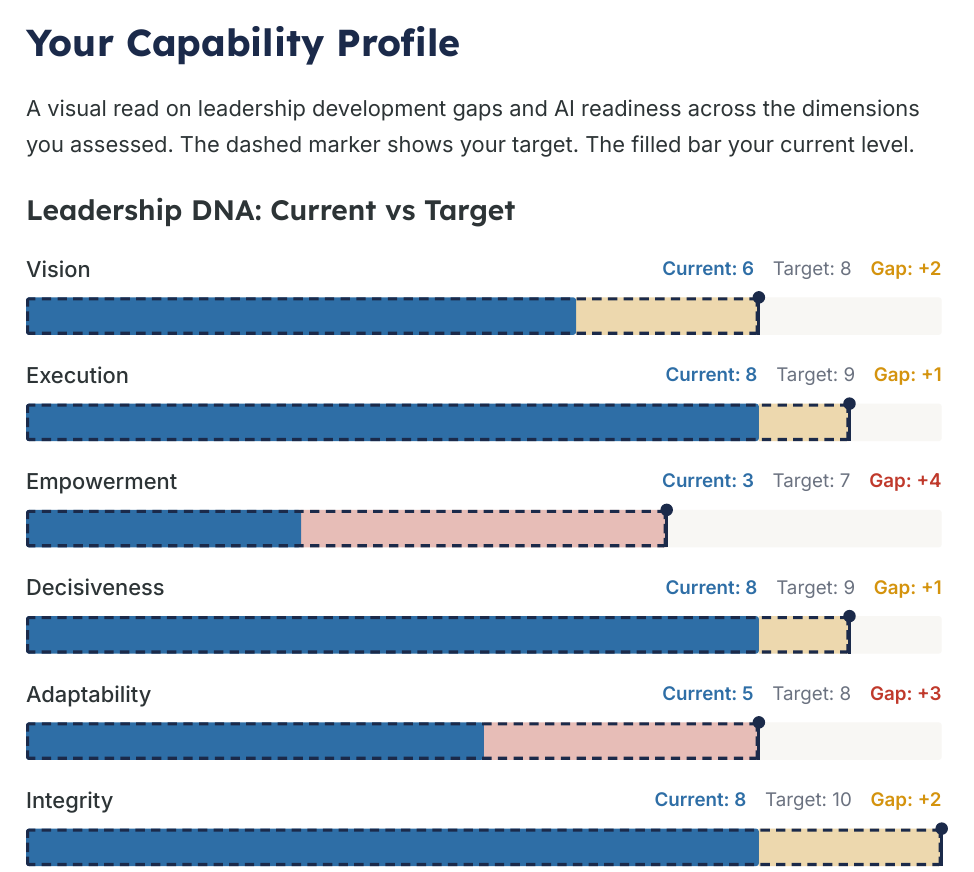
Founder Dependency Index: 5.9 out of 10, substantial single-person risk. Execution to Ambition Ratio: 0.65. Organizational Readiness: 42 out of 100.
Those two readings together describe the actual obstacle. Load planning sits with one person, and the organization has a limited appetite for change. Buying software into that situation produces an expensive tool that one person overrides daily.
The inputs the software needs
A routing tool is only as good as four numbers, and small fleets typically hold none of them reliably.
Cost per mile by truck rather than by fleet, because a paid off tractor and a new one under finance have materially different economics. Cost per hour for the driver, including detention and waiting, because time and distance are separate costs. Historical transit times on the lanes actually run, rather than posted speeds. And revenue per load net of fuel surcharge, so lanes can be compared honestly.
None of those require software to collect. All of them require someone to decide they matter. A fleet that assembles them in a spreadsheet makes better routing decisions with no tool at all than a fleet that installs a tool and feeds it fleet averages.
Fleets reviewing broader structure should read trucking business consultant.
Do you know your cost per mile by truck? Sales Roadmaps builds the numbers before the software. Start with the operations roadmap.
Lane profitability changes what gets accepted
Once the cost per lane exists, the routing question answers itself more often than expected.
Fleets discover that certain lanes are consistently unprofitable once deadhead and detention are factored in. Those lanes usually survive for one of three reasons. The freight came attached to a relationship, or the rate looks acceptable in isolation, or nobody has ever attributed the empty return to the load that caused it.
The response is rarely to drop the lane. It is to reprice it, to pair it with a return load, or to run it only when the truck would otherwise be idle. All three are decisions a dispatcher can make once the number is in place.
The reverse case is equally common. Lanes that look mediocre on rate turn out to be strong once consistent backhaul is attributed to them. The fleet has been underweighting the freight it should be chasing.
Detention is a routing cost, not a customer problem
Time spent waiting at a dock is priced as an inconvenience and behaves like a lane cost.
A shipper that routinely holds a truck for hours is consuming the most expensive asset in the fleet. That cost falls on the lane rather than the shipper, unless someone measures and bills it. Fleets that record arrival and departure times at each stop can produce that evidence within a week.
The routing consequence is direct. A lane with reliable transit and a two-hour dwell is worse than the rate sheet suggests. Pairing it with a tight appointment on the far end multiplies the damage rather than adding to it.
Driver hours are a constraint, not a variable
The plan that ignores hours of service is not a plan.
A route that requires a driver to exceed available hours will be broken in the field, and the version that gets driven is the one nobody planned. Worse, the break happens where the driver is when the hours run out, which is frequently the most expensive place for it to happen.
Planning against remaining hours rather than against a full clock is the correction, and it requires knowing where each driver stands at the point of assignment. That information exists in the electronic logging data that every fleet already collects, and few fleets consult it at the time of dispatch.
Home time belongs in the same calculation. A route that is optimal on cost and returns a driver home two days late has traded a small saving for a recruiting cost. Recruiting costs are higher.
Getting planning off one desk
The structural problem underneath most routing questions is that one person holds the plan.
That person knows the lanes, shippers, drivers, and equipment. They build a good day from memory. They also cannot take a week off, cannot be scaled, and cannot explain the reasoning in a form that anyone else can apply.
Writing down the decision rules is the first move, and it does not require software. Which loads are accepted, at what rate, on what lanes, with what expected return? That document is the specification for any tool bought later, and it is useful immediately, whether or not a tool is ever bought.
Fleets reviewing equipment and utilization should read fleet management consultant.
The sixty-second version
The same situation was typed, in plain language, into a second free tool that returns a written diagnosis rather than scores.

It is named reactive operations combined with growth without structure. It was observed that the routing system runs on memory and real-time calls rather than on data or processes. Then it stated plainly that this is not a technology project first, but an operational design project.
That last sentence is the whole argument of this article, returned in about fifteen seconds. A fleet that builds the day from whatever the phone brought is not routing. No tool changes until the planning horizon extends past the current load.
Where this is not the constraint
If the fleet runs dedicated lanes with fixed schedules, routing is largely fixed, and the lever sits in equipment utilization and driver retention instead.
If the cost per mile is unknown at any level, that comes first. Optimizing against numbers nobody trusts produces confident decisions in the wrong direction.
Both tools used here are free. The written one is at businessconsultant.services, and the scored briefing is at vwcg.app.
The short version
Route optimization is a data problem before it is a software problem. Cost per mile by truck, cost per hour, real transit times, and net revenue per load are the inputs, and most fleets hold none of them.
Track empty miles weekly and attribute deadhead to the load that caused it. Plan against remaining driver hours rather than a full clock. Write the planning rules down before buying any tool to execute them, because the tool will ask for those rules anyway.
Is load planning still living inside one head? Sales Roadmaps writes the rules down. Book a working session.
Frequently Asked Questions
What does route optimization actually optimize?
Total cost across a planning horizon, usually a week, rather than the distance on a single load. A shorter route through congestion or one that ends far from the next load can cost more than a longer route on an open highway.
Why do empty miles matter so much?
Because deadhead is decided when a load is accepted, not when the truck arrives empty. A fleet booking one load at a time is choosing its empty miles without realizing it, and the cost accrues to the load that created it.
What data does routing software need?
Cost per mile by truck rather than fleet average, and cost per hour for driver time, including detention. Historical transit times on the lanes actually run, and revenue per load net of fuel surcharge. Fleet averages produce confident wrong answers.
Why should the cost per mile be tracked by the truck?
Because a paid-off tractor and a financed one have materially different economics. Averaging them hides which equipment is carrying the fleet and which is being subsidized by the rest.
How do driver hours affect routing?
They are hard constraints rather than variables. A plan that exceeds available hours breaks down in the field, wherever the driver happens to be, which is often the most expensive possible location.
Should a fleet buy software first?
No. A fleet that assembles cost and transit data in a spreadsheet will route better than one that installs a tool and feeds it averages. Written decision rules also become the specification for any tool bought later.