
Win rate is the share of qualified opportunities that close. Stated as a single company figure, it is nearly useless. Split by rep, by lead source, and by deal size, it becomes the most actionable number in a sales organization. The split is what almost nobody does.
An aggregate rate describes nothing
One number averaged across everything hides the four things worth knowing.
A company reporting a 30% win rate might have one rep at 50% and two at 20%. It might have referral leads closing at sixty and paid leads at ten. It might close small deals reliably and lose every large one. All three companies report the same figure and need entirely different responses.
The aggregate also moves for reasons unrelated to selling. A change in lead mix shifts it. A change in the qualification standard shifts it. Read without those splits, the number generates confident conclusions about the wrong causes.
The occupation is large. The Bureau of Labor Statistics counted about 1.6 million wholesale and manufacturing sales representative jobs in 2024, with 1 percent growth projected through 2034. Measurement practice varies enormously across that population.
The denominator is the real argument
Win rate is a fraction, and firms argue about the numerator while the denominator is undefined.
If any conversation can be entered as an opportunity, the denominator inflates with things that were never going to close. The resulting rate measures optimism rather than performance. If only near certain deals are entered, the rate looks excellent and forecasts nothing.
A written definition of a qualified opportunity fixes both. Budget identified, decision process understood, a named problem the buyer has agreed exists, and a timeline. Deals failing the definition are not tracked as losses because they were never opportunities.
That definition is worth more than any measurement built on top of it, and it takes an afternoon to write.
A worked example, run through a real tool
The company described below is fictional. It was invented for this article and run through two free assessment tools to show what the output looks like. No real client, company, or person is described. The figures are tool output on invented inputs, not market data or benchmarks.
The simulated profile is a business-to-business commercial services firm. Revenue between eight and fifteen million, thirty-one to sixty staff, ten to twenty years in business, owner working fifty to sixty hours a week.
The weaknesses described are an absence of measurement, not an absence of effort. There is no definition of a qualified opportunity. The forecast is built on how confident each representative feels that week, and the win rate has never been measured by representative or by lead source.
What the assessment returned
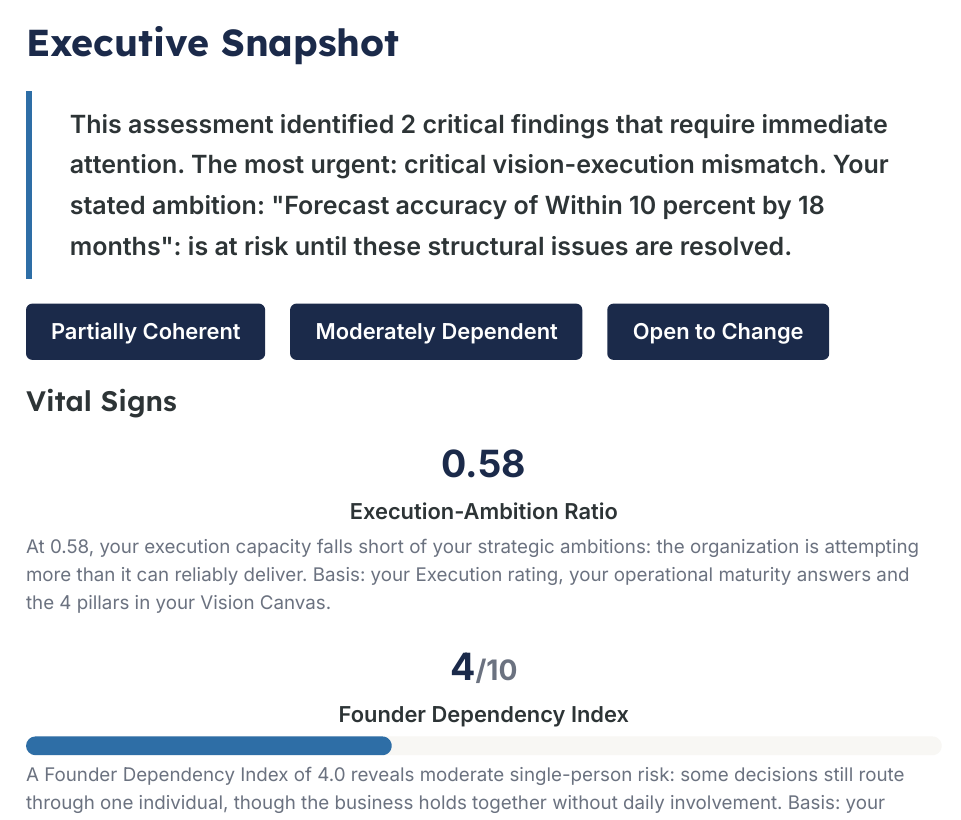
Execution to Ambition Ratio: 0.58, execution capacity falling short of stated ambitions. Founder Dependency Index: 4.0 out of 10, moderate single-person risk. Organizational Readiness: 58 out of 100.
The briefing states the basis for each figure on the page rather than presenting the numbers as opaque scores. That matters when the whole point of the exercise is to argue about the inputs.
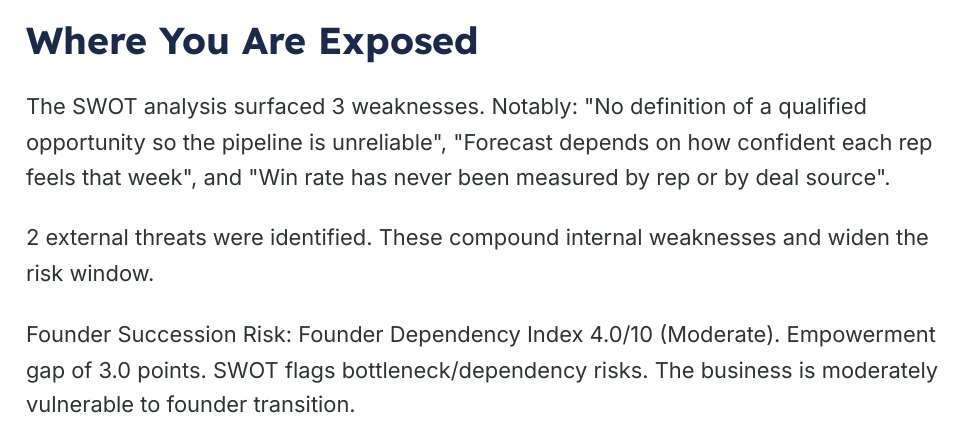
The exposure page reproduces the weaknesses in the words they were entered in. All three are measurement failures, and the readiness score suggests the team will accept such a change if the rationale is explained.
Stage exit criteria make the pipeline mean something
Stages named after activities produce a pipeline nobody can read.
The stages called contacted, presented, and proposal describe what the seller did. A buyer can receive a presentation and a proposal while remaining exactly as far from purchase as before. A pipeline built that way inflates the seller’s effort.
Exit criteria fix it by defining stages around buyer behavior. The buyer has confirmed that a budget exists. The buyer has introduced the signatory. The buyer has agreed on a timeline. Each of those is observable, and each moves the deal.
Once stages have criteria, stage conversion rates become meaningful, and the win rate can be decomposed. A company losing deals at one particular transition has a specific problem rather than a general one.
Firms restructuring the process should read the sales operations roadmap.
Is your forecast a feeling? Sales Roadmaps defines the qualification standard and the stages. Start with the operations roadmap.
Win rate by source reprices marketing
The split that changes the budget fastest is by lead source.
Companies routinely fund the source that produces the most leads rather than the source that produces the most revenue. Those are frequently different sources, and the gap is invisible without the source-level win rate and average deal size.
The calculation is straightforward once the data exists. Leads multiplied by win rate multiplied by average deal value, compared against cost per lead. That produces a return per source, and it commonly reverses a spending decision that has run unexamined for years.
Referral sources usually win this comparison by a wide margin, and companies still underinvest in them because referrals feel free. They are not free. They are unmanaged, which is a different thing and fixable.
Deal size changes the whole calculation
A win rate that ignores deal size can lead a company to optimize itself into smaller revenue.
Small deals close more often and consume less time, so a team measured purely on win rate has a rational incentive to pursue them. That produces an excellent number and a flat revenue line, which is the specific failure this metric creates when it is used alone.
Reporting the win rate in size bands corrects it. Deals below a threshold, deals within a middle band, and deals above. Three numbers, and the pattern usually shows a clear point at which the process stops working.
That breakpoint is diagnostic. Deals above it typically involve more stakeholders, longer evaluation, and a competitive process that the team has never been trained for. None of that is visible in a blended figure.
Loss reasons are only useful when they are honest
Recorded loss reasons cluster on price because price is the reason buyers give, and the easiest thing to write down. It is rarely the real one.
Price is rarely the actual cause. Buyers say price when they mean the value case was not made. They say it when a competitor understands the problem better. They also say it when the decision has already been made, and an exit is needed.
Getting closer to the truth requires asking the question after the decision rather than during it, and asking someone other than the person who lost the deal. A short conversation two weeks later produces materially different answers.
Categories should be few and behavioral: no decision, lost to a named competitor, budget removed, wrong fit, and lost on value. Five categories are used consistently, while twenty are used loosely.
Founder involvement distorts every measurement
Where the owner closes the largest deals personally, none of the numbers describe the sales team.
Those deals enter the pipeline with different probabilities, receive different levels of attention, and close at different rates. Averaged in, they lift the company’s win rate and conceal what the team achieves without that involvement.
The measurement fix is to segment them. Deals with founder involvement and deals without founder involvement, tracked separately, produce two honest numbers instead of one flattering one.
The structural fix takes longer. A defined threshold above which the founder participates, plus a documented closing process below it, transfers ownership gradually and provides evidence of whether the transfer is working.
Process design sits in the sales process consultant.
The sixty-second version
The same situation was typed, in plain language, into a second free tool that returns a written diagnosis rather than scores.

It is named a sales and revenue plateau compounded with founder dependency. It was observed that an owner closing large deals personally masks two failures at once. The pipeline cannot be trusted, and the team never develops its own closing capability.
It also names the consequence precisely. The owner becomes the revenue insurance policy, which means growth requires the owner to close proportionally more, and that is a ceiling rather than a plan.
Where this is not the constraint
If deal volume is very low, the win rate is statistically noisy, and individual deal reviews are more informative than the win rate.
If lead volume is the binding constraint, demand generation precedes measurement. A well-measured pipeline with nothing in it does not produce revenue.
Both tools used here are free. The written one is at businessconsultant.services, and the scored briefing is at vwcg.app.
The short version
A company’s win rate is an average that conceals the four splits worth having. Rep, lead source, deal size, and founder involvement each yield a distinct, actionable answer.
Define a qualified opportunity in writing and set exit criteria for each stage. Calculate return per lead source rather than cost per lead. Keep the reasons for loss to five behavioral categories, and separate founder-led deals from the rest so both numbers stay honest.
Forecast built on confidence rather than criteria? Sales Roadmaps replaces it. Book a working session.
Frequently Asked Questions
Why is a single company’s win rate not useful?
Because it averages across reps, lead sources, and deal sizes that behave differently. Three companies with opposite problems can report the same figure, and the aggregate also moves when lead mix or qualification standard changes rather than when performance does.
What defines a qualified opportunity?
Budget identified, decision process understood, a named problem the buyer has agreed exists, and a timeline. Without a written definition, the denominator inflates with deals that were never going to close, so the rate measures optimism instead of performance.
What are stage exit criteria?
Conditions defined by buyer behavior rather than seller activity. The buyer has confirmed budget exists, has introduced the signer, has agreed a timeline. Stages named after seller actions inflate the pipeline on effort rather than progress.
How should lead sources be compared?
By leads multiplied by win rate multiplied by average deal value, measured against cost per lead. That produces return per source and frequently reverses a spending decision made on lead volume alone.
Why are recorded loss reasons unreliable?
Because they cluster on price, which is what buyers say and what is easiest to write down. Asking two weeks after the decision and asking someone other than the person who lost the deal produces materially different answers.
How does the founder’s selling distort the win rate?
Founder-led deals enter with different probabilities and levels of attention, so averaging them lifts the company figure and obscures what the team achieves on its own. Segmenting deals with and without founder involvement produces two honest numbers.