
Churn is the rate at which existing relationships end. In a practice or service business, it is the quietest number in the operation, because nobody leaves. They simply do not come back, and an absence produces no event, no notification, and no entry in any report.
Departure is silent by construction
Every other business problem announces itself. This one does not.
A complaint arrives. A refund is requested. A resignation is submitted. Attrition of this kind involves none of that. The person schedules nothing, and the schedule fills with somebody else, so the gap is invisible at the level where it would be noticed.
By the time a thin schedule prompts a conversation, the losses have accumulated over a year or more. The response is then a marketing push to replace people the practice already had, at several times the cost of keeping them.
The sector is large. The Bureau of Labor Statistics counted 839,000 physician and surgeon jobs in 2024, with 3 percent growth projected through 2034. Retention practice varies enormously across it and is rarely measured at all.
Without a definition, there is no number
The first obstacle is not measurement. It is that nobody has said what counts as active.
Active has to be a rule: seen within a defined period appropriate to the type of care. Eighteen months, twenty-four months, whatever fits the pattern of the practice. Until that rule exists, the total in the system counts everyone ever recorded, which grows forever and means nothing.
Once the rule exists, the arithmetic is immediate. Active at the start of the year, minus those still active at the end, divided by the starting number. One figure, produced from data already held.
The number is usually higher than anyone in the practice expected. That reaction is itself the finding, because it demonstrates the scale of what was being managed by impression.
A worked example, run through a real tool
The company described below is fictional. It was invented for this article and run through two free assessment tools to show what the output looks like. No real client, practice, or person is described. The figures are tool output on invented inputs, not market data or benchmarks.
The simulated profile is a multi-provider medical practice. Revenue between eight and fifteen million, with several clinicians and a front office team.
The weaknesses described are systems that are absent rather than care that is absent: no recall process, no tracking of whether people return, and high front-desk turnover, compounding both.
What the assessment returned
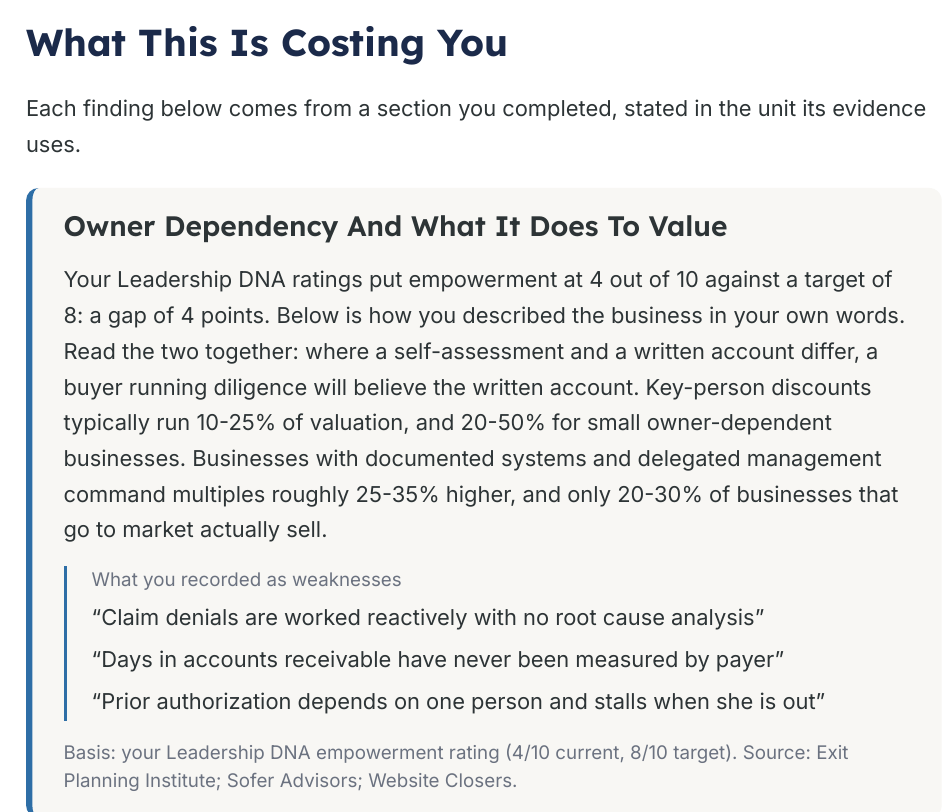
The cost section states each finding in the unit, its own evidence uses. It names which part of the assessment produced the finding rather than presenting a single blended figure.
Execution to Ambition Ratio: 0.61. Founder Dependency Index: 4.4 out of 10. Organizational Readiness: 43 out of 100.
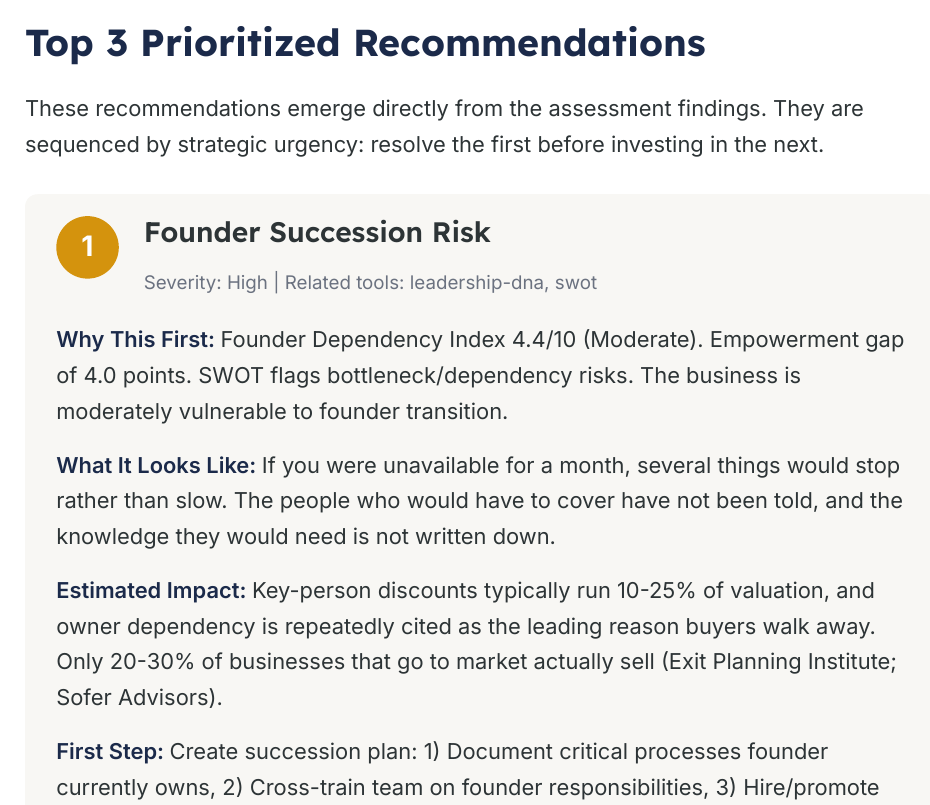
The recommendations are sequenced by urgency rather than by ease of implementation.
A readiness score in the low forties is the constraint worth noting before anything is launched. A recall process introduced as an instruction to an already stretched front office will be abandoned within a month.
The recall system is the whole intervention
One mechanism addresses most of what this article describes.
A recall system identifies who is due, contacts them, and records the outcome. It is not marketing, and it is not a reminder for an appointment already booked. It is the process that notifies someone when they have not returned when they should have.
The reason it works is that most attrition is not a decision. People intend to come back, life intervenes, and nothing prompts them. A contact at the right moment recovers a large share of them, because there was never any dissatisfaction to overcome.
The recording matters as much as the contacting. Contacted, response, outcome. Without that, nobody can tell whether the process is working, and the first quiet month kills it.
Practices reviewing operations should read medical practice consultant.
Do you know how many people did not come back? Sales Roadmaps builds the definition and the recall. Start with the operations roadmap.
Front desk turnover is a retention problem
The connection between staff churn and customer churn is direct and usually unexamined.
The front office holds the relationships. They recognize people, remember circumstances, and notice when someone seems unhappy. That knowledge is informal and unrecorded, and it leaves entirely when the person does.
A practice cycling through front-desk staff, therefore, experiences repeated relationship resets that no clinical quality can compensate for. The patient encounters a stranger who has to ask everything again, and the experience degrades without anything having gone wrong.
The mitigation is partly the retention of staff and partly reducing its dependence on memory. Structured notes on preferences and circumstances, held in the record rather than in individual memory, survive a departure. That is unglamorous, and it is what makes the operation resilient.
Reactivation is cheaper than acquisition
The people who left are a better prospect list than anyone who has never attended.
They know the practice, they were satisfied enough to return at least once, and the records already hold what they came for and when. Reaching them requires no advertising or introduction, which is why the return on a reactivation campaign usually exceeds that of any marketing budget.
The message matters more than the channel. A generic invitation to book performs poorly. A specific note that a particular check is now overdue, referencing what they last attended for, performs several times better. It is about them rather than about the practice.
Expect a modest response rate and treat it as a floor. The exercise also cleans the list, because contacts that bounce or decline identify people who were never coming back and were inflating the denominator.
The exit signals arrive before the exit
People rarely leave without first producing evidence, and the evidence is recorded but unread.
A canceled appointment that was never rebooked. A second no-show. A gap noticeably longer than the interval that an individual normally keeps. A complaint that was resolved politely and never followed up. Each of those is a moment where a short contact changes the outcome, and nobody is watching for it.
Turning them into triggers is the work. A weekly list of people who canceled without rebooking, and of people whose gap has exceeded their normal interval, is a report most practice systems can already produce.
The contact itself does not need to be sophisticated. Someone noticing and asking is unusual enough to do most of the work, and it costs a few minutes against a relationship worth years.
Look at cohorts, not the total
An overall rate indicates that a practice has a problem. Cohorts tell it where.
Grouping by when people first arrived reveals whether losses concentrate early or accumulate steadily. Early concentration indicates an onboarding or expectation problem, since the relationship has never been established. Steady loss over the years indicates something in the ongoing experience.
Grouping by referral source reveals whether particular channels bring people who do not stay. That is a marketing spend question disguised as a retention question, and it frequently reverses a budget decision.
Grouping by provider reveals variation that is uncomfortable to look at and highly informative. Where one clinician retains materially better than another with similar cases, something specific is happening that can be described and taught.
Broader operational framing sits in operations consultant.
The sixty-second version
The same situation was typed, in plain language, into a second free tool that returns a written diagnosis rather than scores.
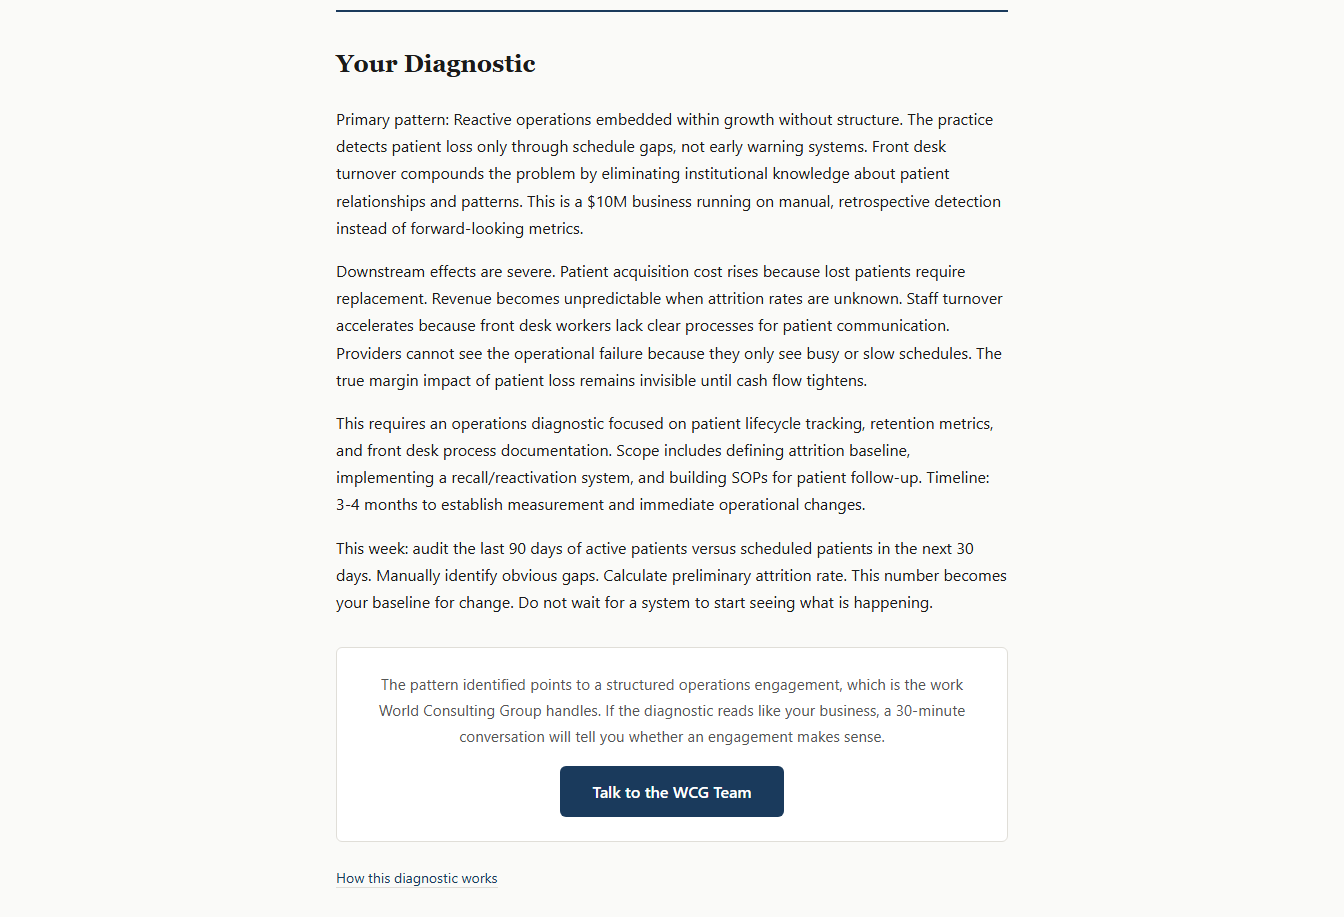
The diagnosis reads this as an absence of early warning systems rather than as a service quality failure, which is the accurate distinction.
Early warning is exactly what is missing. A practice can deliver excellent care and still lose a large share of its base annually without any signal reaching anyone. Nothing in the operation is designed to notice an absence.
Where this is not the constraint
If the work is genuinely episodic, with no expectation of return, retention is the wrong frame, and referral volume is the metric that matters.
If capacity is full and the waiting list is long, attrition is being masked by demand. It is still worth measuring, because demand conditions change and the underlying rate does not.
Both tools used here are free. The written one is at businessconsultant.services, and the scored briefing is at vwcg.app.
The short version
Attrition produces no event, so it stays invisible until a schedule looks thin. By then, a year of losses has already happened, and replacement costs several times what retention would have.
Define what “active” means and calculate the rate using the data already held. Build a recall process that records both outcomes and contacts. Reduce how much of the relationship lives in a single memory, and split the number by cohort, source, and provider to locate where the losses come from.
Losing people and finding out at the schedule? Sales Roadmaps builds the early warning. Book a working session.
Frequently Asked Questions
Why is churn hard to notice?
Because an absence produces no event. Nobody complains, resigns or requests a refund. They simply do not schedule again, and the calendar fills with someone else, so the loss never surfaces where it would be seen.
What has to be defined before churn can be measured?
What counts as active? A rule such as seen within eighteen or twenty-four months, chosen to fit the pattern of the work. Without it, the system’s total count of everyone ever recorded grows forever.
How is the rate calculated?
Active at the start of the period, minus those still active at the end, divided by the starting number. Every input already exists in the records once the definition of active has been set.
What does a recall system do?
It identifies who is due, contacts them, and records the outcome. Most attrition is not a decision but an intention that nothing prompted, so a well-timed contact recovers a large share with no dissatisfaction to overcome.
How does front desk turnover affect retention?
The front office holds informal relationship knowledge that leaves entirely with the person. Repeated resets mean people meet strangers who ask the same questions again, degrading the experience even when nothing has gone wrong.
Why analyze churn by cohort?
Because an overall rate identifies a problem without locating it. Early-concentrated losses indicate an onboarding issue. Steady loss indicates the ongoing experience. Splitting by source and by provider reveals where to act.