
Inventory turns measure how many times stock is sold and replaced over a period. A low figure means capital is sitting idle. The confusing part is that the same operation usually holds too much of the wrong stock and not enough of the right stock simultaneously. That is also why the problem persists.
Dead stock and stockouts share one cause
They look like opposite problems, and they come from the same absence.
Both are produced by ordering without demand data. Someone at the counter orders what feels short, in a quantity that feels safe, from a supplier who happens to be convenient. Fast-moving items run out of stock because nobody sets a reorder point. Slow-moving items accumulate because nobody ever reviews what was already there.
The correct diagnosis is therefore not too much inventory or too little. It is that the ordering decision is being made on intuition at the moment of need, by a person with no visibility into the pattern.
The sector is substantial. The Bureau of Labor Statistics counted 805,600 automotive service technician and mechanic jobs in 2024, with 4 percent growth projected through 2034. Parts availability is what determines whether those technicians are productive.
Aggregate turns hide everything
One turn figure for the whole operation is a number that cannot be acted on.
Stock is not homogeneous. A small proportion of items typically accounts for most of the movement, a middle group turns steadily, and a long tail barely moves at all. Averaged together, a healthy, fast-moving core makes an inventory full of dead stock look acceptable.
Splitting the stock into three bands by annual usage value takes an afternoon and changes every subsequent decision. The fast group justifies tight reorder points and frequent review. The middle group justifies periodic review. The tail justifies a decision about whether to hold it at all.
Turns should then be measured per band. The tail will look terrible, which is the point, because that is where the cash is.
A worked example, run through a real tool
The company described below is fictional. It was invented for this article and run through two free assessment tools to show what the output looks like. No real client, company, or person is described. The figures are tool output on invented inputs, not market data or benchmarks.
The simulated profile is a franchise automotive dealership group. Revenue between thirty and fifty million, with a parts and service operation alongside vehicle sales.
The weaknesses described are an absence of measurement, not an absence of effort. Departmental numbers never reconcile. Pricing is set independently in each area, and there is no visibility into margin by customer or job type.
What the assessment returned

The briefing pairs published benchmark figures with what the owner actually typed, and names the source beneath each block rather than presenting the numbers as its own research.
Execution to Ambition Ratio: 0.71. Founder Dependency Index: 4.4 out of 10. Organizational Readiness: 46 out of 100.
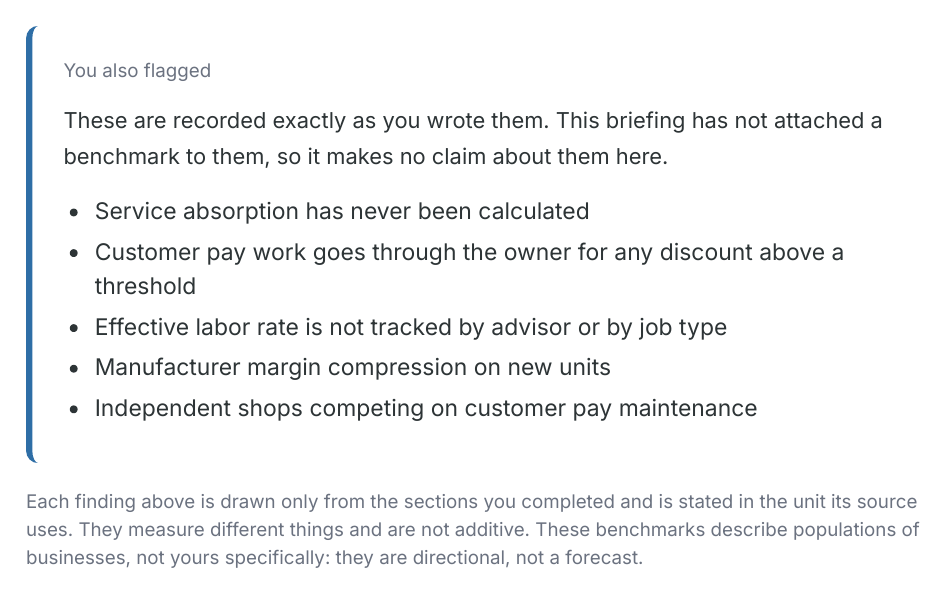
The flagged weaknesses are reproduced verbatim, with no cost attached, which is the correct treatment. That departmental numbers do not reconcile is a fact. What it costs depends entirely on the mix.
Inventory is the clearest case of that principle. Capital tied up in stock has a cost, but the amount depends on what else the business would do with the money.
Obsolescence is a decision, not an event
Stock does not become worthless on a particular day. It becomes worthless because nobody decided anything for long enough.
The reason it accumulates is psychological rather than analytical. Writing off an item is an admission that money was wasted, so the item remains on the shelf, where it still looks like an asset. Meanwhile, it consumes space, gets counted, gets insured, and obscures the real position.
A scheduled review removes the need for an individual decision. Any item with no movement for a defined period automatically appears on a list, and the list is worked rather than debated item by item. Return to the supplier where possible, sell into a secondary market, discount to clear, or scrap.
The proceeds are almost never the point. The point is to recover the space, the counting effort, and the honesty of the balance sheet, and to stop the accumulation from continuing.
Dealership groups reviewing fixed operations should read operational inefficiencies in car dealerships.
How much of that stock room is dead? Sales Roadmaps builds the bands and the review. Start with the operations roadmap.
Reorder points beat ordering by feel
The mechanism that fixes stockouts is arithmetic that most operations have never done.
A reorder point is the quantity at which replenishment is triggered. It equals usage during the supplier lead time plus a buffer sized to the variability of that usage. Both inputs come from the operation’s existing history rather than from a supplier recommendation.
Set that way, the fast-moving items stop running out without anyone noticing they are low. The person at the counter stops being the early warning system, which is the role they were never equipped to perform.
The buffer is where judgment enters. Items for which a stockout prevents a technician from working justify a larger one. Items easily obtained the same day from a local source justify almost none. Treating every item with the same safety margin is the expensive middle path.
Counting has to be believable
Every control described here assumes the recorded quantity matches the shelf, and in most operations, it does not.
Inaccuracy compounds quietly. A reorder point cannot trigger correctly when the wrong number is used. A review of slow movers cannot identify items that the system considers absent. Staff who have learned the record is unreliable stop consulting it and go and look, which removes the benefit of having it.
Annual wall-to-wall counting is the traditional answer and the weakest one. It is disruptive, it happens once, and the record drifts again immediately afterward.
Cycle counting works better. A few items are verified every week, weighted toward the fast band, and the record is kept honest continuously. It also surfaces the causes of drift while anyone can still remember them.
Supplier terms shape the right stock level
How much inventory an operation should hold depends heavily on the terms it can negotiate, rather than only on demand.
Lead time is the first lever. A supplier delivering next day permits far lower stock than one delivering in three weeks. That difference is worth a small premium on fast-moving items.
Return rights are the second. The ability to periodically send back slow-moving stock can turn an ordering mistake from permanent to temporary. That is worth more than a modest discount on the original purchase.
Both are negotiable and rarely negotiated, because purchasing conversations focus on unit price. A slightly higher unit price with next-day delivery and return rights usually yields a better overall position than the cheapest quote without either.
Fill rate is the measure that matters to the customer
Turns measure capital efficiency. Fill rate measures whether the business can do the work.
Fill rate is the share of demand satisfied from stock on hand at the moment it is requested. It is the figure that determines whether a technician is productive, whether a job is completed in one visit, and whether a customer waits.
Measured together, the two numbers keep each other honest. Turns alone can be improved by holding nothing, which destroys service. Fill rate alone can be improved by holding everything, which destroys cash. The objective is a high fill rate on the fast band and unapologetically low coverage on the tail.
Very few operations measure fill rate at all. That is why inventory discussions so often become an argument between the parts side and the service side, with no shared evidence.
Broader operational framing sits in operations consultant.
The sixty-second version
The same situation was typed, in plain language, into a second free tool that returns a written diagnosis rather than scores.

The diagnosis treats the inventory position as a process and visibility failure rather than as a purchasing mistake, which matches the assessment reading.
Process is the right frame. Nobody bought the dead stock deliberately. It accumulated because ordering was a series of individual judgments with no review behind them, and it will accumulate again unless the review exists.
Where this is not the constraint
If the operation carries little stock and has few orders per job, turns are not the lever; lead time management is.
If storage space is free and capital is not constrained, the cost of slow stock is genuinely lower, and the priority sits elsewhere.
Both tools used here are free. The written one is at businessconsultant.services, and the scored briefing is at vwcg.app.
The short version
Dead stock and stockouts are the same failure, produced by ordering on intuition at the moment of need. An aggregate turns figure conceals both.
Split stock into three bands by annual usage value and measure turns per band. Run a scheduled obsolescence review, so the decision is automatic rather than personal. Calculate reorder points based on lead time and usage variability, and track fill rate alongside turns so neither metric can be gamed.
Cash parked in the stock room? Sales Roadmaps gets it back. Book a working session.
Frequently Asked Questions
What do inventory turns measure?
How many times is stock sold and replaced over a period? A low figure means capital is parked. The complication is that the same operation usually holds too much of the wrong stock and too little of the right stock simultaneously.
Why do dead stock and stockouts occur together?
Both come from ordering without demand data. Fast-moving items run out because no reorder point was set. Slow items accumulate because nobody reviews what is already held. The shared cause is intuition at the moment of need.
Why is an aggregate turn figure misleading?
Because stock is not homogeneous. A healthy, fast-moving core averages together with a long dead tail, producing an acceptable-looking number. Turns should be measured separately for each usage band.
How should a reorder point be calculated?
Usage during the supplier lead time plus a buffer sized to the variability of that usage, both drawn from the operation’s own history. The buffer should be larger where a stockout would stop work, and minimal where the item is locally available.
Why does obsolete stock accumulate?
Because writing an item off admits money was wasted, it stays on the shelf looking like an asset while consuming space, effort, and insurance. A scheduled automatic review removes the individual decision.
What is fill rate, and why measure it?
The share of demand satisfied from stock on hand when requested. Turns alone can be improved by holding nothing, which destroys service. Measuring together the two figures prevents either from being gamed.