Owner-operator fleets rarely lose money on rates. They lose it in the gap between the rate booked and the cost actually incurred, which most carriers cannot measure by lane or by truck. Without a per-mile cost at that resolution, unprofitable freight is invisible until the year closes.
The owner-operator model and what it hides
The model is attractive for a reason. Capital sits with the driver, maintenance risk transfers, and the carrier scales without buying tractors.
What it hides is where the margin actually goes. Settlement complexity replaces equipment cost. Deductions, escrow, fuel advances, chargebacks, and accessorial splits multiply across drivers, and each one is a place where a small error repeats every week for a year.
The driver population is enormous. The Bureau of Labor Statistics counted about 2.2 million heavy and tractor-trailer driver jobs in 2024, with 4 percent growth projected through 2034. Access to drivers is a market problem. Knowing which of them is profitable is an internal one.
Cost per mile is not one number
Most carriers can produce a company-wide cost per mile. That figure is nearly useless for decision-making.
Cost per mile varies by lane, truck, driver, and freight type. A dedicated run with predictable backhaul and a spot load into a dead zone can show the same revenue per mile and opposite margins. When averaged together, they produce a number that is true overall but wrong everywhere.
The resolution that matters is per truck per week. That is granular enough to act on and coarse enough to actually maintain.
Load planning as a bottleneck
When one person builds every load plan, capacity is capped at a single morning’s length.
The load plan is not a scheduling task. It encodes rate judgments, driver preferences, hours of service, equipment positions, and customer tolerances. It is the highest skill work in the building, which is exactly why it never gets delegated and exactly why it must be.
The transferable part is not the judgment. It is the criterion. An owner who can write down what makes a load acceptable has converted intuition into something a dispatcher can run.
Dedicated lanes and freight mix
Freight mix determines margin more than negotiation does, and it is the lever most small carriers use least.
Dedicated freight carries lower headline rates and better economics. The truck knows where it goes, the backhaul is arranged, the driver knows the schedule, and the customer relationship survives a soft market. Spot freight pays more per load but costs more due to deadhead, waiting time, and driver frustration.
A carrier that cannot measure cost per mile by lane cannot evaluate that trade. The spot load looks better because the rate is visible, and the cost is not. This is the specific way the measurement gap becomes a strategy error rather than an accounting one.
The practical target is a mix rather than a purity. Enough dedicated volume to cover fixed cost and stabilize the driver schedule, with spot capacity retained to capture upside. Carriers that go fully dedicated surrender pricing power. Carriers running fully spot surrender predictability and, eventually, drivers.
Driver retention is a margin line
Turnover is usually filed under recruiting rather than operations, which is why its cost is rarely stated.
A departing driver takes a tractor out of service until it is replaced, then spends orientation time, then runs below standard productivity while learning the lanes and customers. In a fleet of twenty-five trucks, a handful of departures a year is a meaningful fraction of capacity permanently in transition.
The two operational causes are within the carrier’s control. Settlements that a driver cannot verify, and a schedule that does not return them home when promised. Both trace back to the same root as the margin problem: planning that lives in one head and pay that is calculated by hand.
That is the argument for sequencing dispatch and settlement work ahead of a recruiting push. Recruiting into an unfixed system refills a bucket with a hole in it.
A worked example, run through a real tool
The company described below is fictional. It was invented for this article and run through two free assessment tools to show what the output looks like. No real client, company, or person is described. The figures are tool output on invented inputs, not market data or benchmarks.
The simulated profile is a regional trucking and freight company. Revenue between three and eight million, sixteen to thirty staff, ten to twenty years in business, owner working sixty to seventy hours a week.
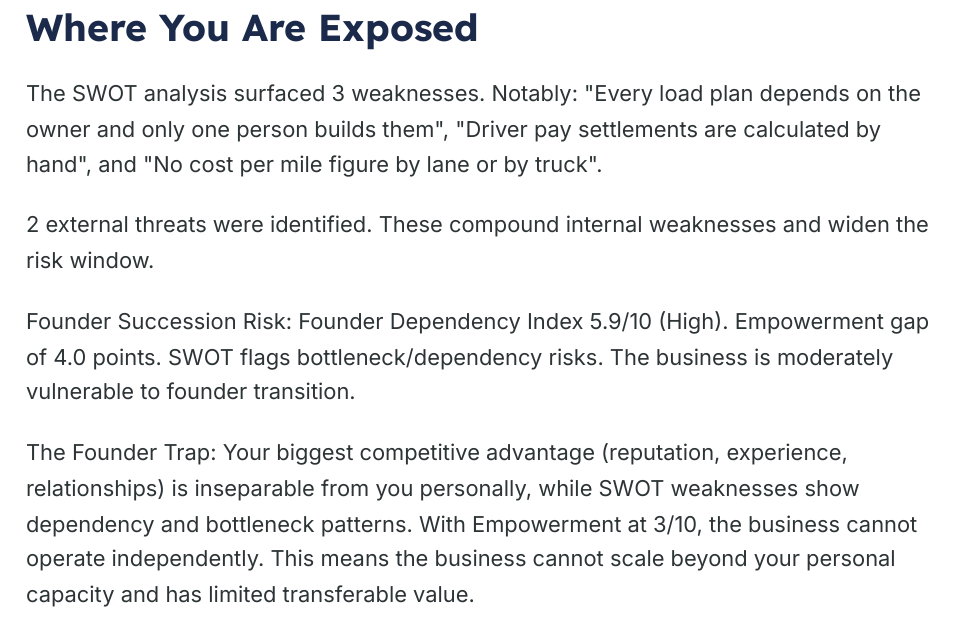
The three weaknesses entered at the highest confidence were:
- Every load plan depends on the owner, and only one person builds them
- Driver pay settlements are calculated by hand
- No cost per mile figure by lane or by truck
What the assessment returned
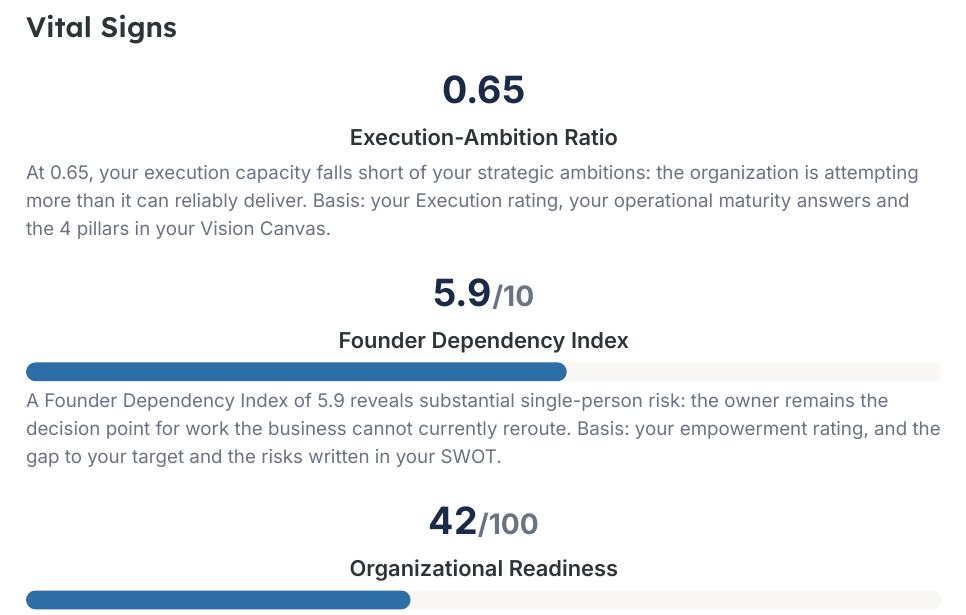
Execution to Ambition Ratio: 0.65. Execution capacity falls short of stated ambitions, and the organization is attempting more than it can reliably deliver.
Founder Dependency Index: 5.9 out of 10. Substantial single-person risk, with the owner remaining the decision point for work the business cannot reroute.
Organizational Readiness: 42 out of 100.
Both numbers moved in the same direction, which is the signature of a capacity problem rather than a strategy problem. The plan is not wrong. There is one person available to execute it.
Driver settlements calculated by hand
Manual settlements are the least-discussed margin leak for small carriers because the error is small each time, and the process feels like administration rather than finance.
Every deduction applied from memory, every fuel advance reconciled late, and every accessorial split decided case by case is a variance nobody can audit. Multiply a few dollars by a few hundred settlements per year, and the number stops being a round number.
The secondary cost is driver trust. A settlement a driver cannot verify is a settlement a driver assumes is wrong. Driver churn in a carrier this size costs far more than the discrepancy.
Carriers reviewing their broader risk posture can start with cargo insurance requirements.
Want load planning off your desk without losing rate discipline? Sales Roadmaps writes the criteria and the handoff. Start with the operations roadmap.
What to build first
Cost per mile for trucks comes first because every other decision depends on it. It requires fixed-cost allocation, a fuel figure that reflects actual purchases rather than an index, and settlement data clean enough to be attributable.
Load acceptance criteria come second. Minimum rate per mile by lane, deadhead tolerance, and the customers who get exceptions. Written down, those turn dispatch into a role rather than a person.
Settlement automation comes third. It is the least strategic and the most tedious, which is why it is usually attempted first and abandoned.
Fixed cost allocation, done simply
The obstacle to cost per mile is usually fixed cost allocation, and it is where the exercise stalls.
Insurance, permits, office salaries, software, and management time do not attach to a load in any obvious way. Faced with that, most carriers either skip fixed cost entirely, which understates cost badly, or attempt a precise allocation model and abandon it after two weeks.
The workable version is crude. Total annual fixed cost divided by total annual miles gives a fixed cost per mile. Add it to the variable cost per mile for each truck. The result is imperfect and directionally correct, and directionally correct arrives in time to change a decision.
Refinement can come later, and usually should not. A carrier acting on a rough number weekly beats one still building a precise model next quarter.
The sixty-second version
The same situation was typed, in plain language, into a second free tool that returns a written diagnosis rather than scores.
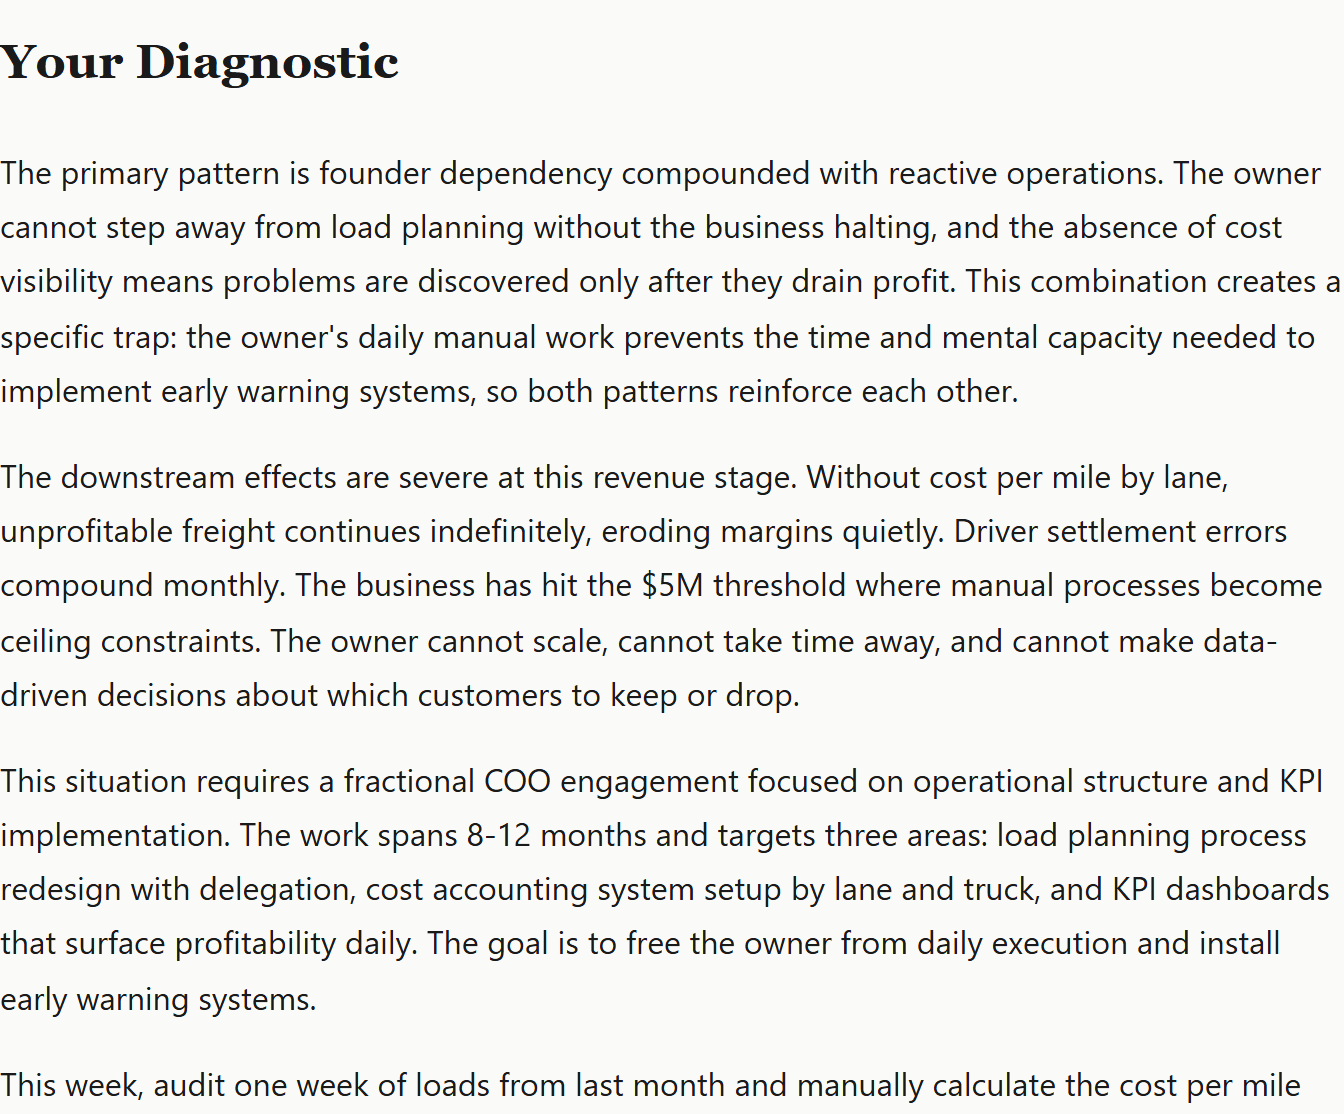
It is named founder dependency compounded with reactive operations. The consequence is stated plainly: the owner cannot step away from load planning without the business halting. The absence of cost visibility means problems are discovered only after they have been paid for.
Where this analysis does not apply
If rates are structurally below cost across the whole book, better measurement will show the loss faster without changing it. That is a freight mix and customer problem, and the tell is that every lane is thin rather than a few.
If the constraint is drivers rather than freight, the sequence inverts. Retention and recruiting come before dispatch delegation, because a planner with no trucks is not the bottleneck.
A structured diagnostic separates those before money is committed. Both tools used here are free. The written one is at businessconsultant.services, and the scored briefing is at vwcg.app. New carriers should also review motor carrier insurance requirements.
The short version
Owner-operator carriers do not usually have a rate problem. They have a resolution problem. Cost is known at the company level and decided at the load level. The gap between the two is where the year goes.
Measure cost per mile by truck, write down what makes a load acceptable, then hand the plan to someone else. In that order.
Not sure whether the problem is freight mix, cost visibility or drivers? Sales Roadmaps maps the constraint first. Book a working session.
Frequently Asked Questions
What does owner-operator mean in trucking?
An owner-operator is a driver who owns or leases their own tractor and contracts with a carrier rather than being an employee. The carrier gains capacity without buying equipment, shifts maintenance, and finances the risk to the driver.
How is the cost per mile calculated for a fleet?
Divide the total operating cost by the total miles, but do it per truck rather than company-wide. A fleet-level average blends profitable dedicated runs with unprofitable spot freight, producing an overall figure that is accurate yet misleading for individual decisions.
Why do manual driver settlements cost money?
Deductions applied from memory, late fuel advance reconciliation, and case-by-case accessorial splits create variances nobody can audit. Small errors repeat weekly across many drivers. The higher cost is driver churn caused by settlements that drivers cannot verify.
How do you delegate load planning?
Write down the acceptance criteria rather than the judgment. Minimum rate per mile by lane, deadhead tolerance, and which customers receive exceptions. Documented criteria convert dispatch from a person-based role to one that another person can perform.
What is a good operating ratio for a small carrier?
The operating ratio compares operating expenses to revenue; the lower it is, the better. The useful practice is to track the trend per truck rather than benchmark a single number. Lane mix and equipment age move the figure more than management quality does.
What should a carrier fix first?
Cost per mile by truck, because every other decision depends on it. Load acceptance criteria second, since those enable delegation. Settlement automation third. It is the most tedious and the least strategic, which is why it is usually attempted first.